Algorithm – Addition

L.I: To calculate the sum of whole numbers using algorithm

L.I: Carry numbers to the next column if needed.

Algorithm is a method used in math to add, subtract, and multiply big numbers. To be able to use algorithm you would need to know your place value and basic number knowledge. Like times tables and simple addition or subtraction. Algorithm Additionis lining up the numbers in their correct column and adding them that way. For example, to solve 245 + 123, you would line up the ones in it’s own colums, the tens in its own column and the hundreds in its own column. The ones would be 3 and 5, the tens would be 20 and 40, and the hundreds would be 200 and 100. You add the ones with the ones, the tens with the tens, and the hundreds with the hundreds.

I loved learning algorithm addition because it taught an easier method to add big numbers, especially if it goes up to millions, or even billions.

Types of lines and Vocabulary – Strand

L.I: Understand the vocabulary of lines.

We learnt 3 types of lines, parallel, perpendicular, and intersecting lines. Parallel lines are lines that would never touch even if they go on forever. Perpendicular lines are lines that when they cross it would form a 90 degree angle. An intersecting line is a line that cross each other but do not make a 90 degree angle. A point is a dot at any particular spot. A ray is a line that has a start and not an end. A line goes on forever in both sides. And a line segment is a line that has start and an end.

I enjoyed this activity because it taught me important vocabulary that is needed in our lessons and tests.

2D and 3D shapes – Strand

L.I: How 2D and 3D shapes are defined.

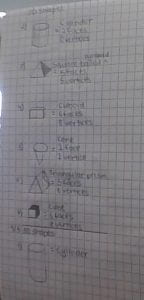
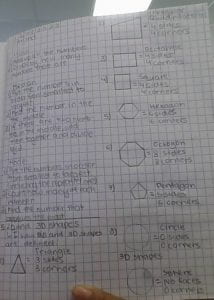
2D shapes have two dimesions, length and width. 3D shapes have 3 dimensions, length, width and height. We drew 3D and 2D shapes in our math book, and wrote the properties of the shape itself. Properties are what the shape owns. For example, the properties of a cube is 6 faces, 12 edges, and 8 vertices (corners). The properties of a square would be 4 sides and 4 vertices (corners).

I enjoyed this activity because it reminded me of the properties of some 3D and 2D shapes.

Statistical Investigation – Blog Posts

L.I: To read the text, gather, sort, graph, and analyse the data.

This DLO shows how many blog posts Lisea has posted from 2022 – 2023. To gather the data, we checked Lisea’s blog posts from 2022 – 2023, and recorded it onto a spreadsheet. With the data collected, we can see that the month with most blogs is November 2022. Me and Lisea posed a question and we came up with “Why are the more blogs on one month than the other”?. And we came up with some reasons why like there aren’t that many blogs on January because school hasn’t started yet.

Mean, Median, and Mode: What are they?

Mean: To find the mean, add all the numbers and divide the sum by the amount of numbers there are. Median: To find the Median, order the numbers from smallest to largest, and whatever number is in the middle that is the Median. In some cases there may be 2 median numbers. Just add them together and divide it by 2. Mode: The Mode is ordering the numbers from smallest to largest. And whichever number is most repetitive, that would be the Mode.

Place Value

L.I: To explore numbers (Written, Expanded, Numerals)

Place Values are numbers separated into their own columns. An example of place Value is, in 123, the 1 is in the hundreds column, the 2 is in the tens column, and the 3 is in the ones column. To make this DLO, me and my partner first learned about what Place Value is, and then explained it in our own words. We added facts into our DLO. Did you know that Place Value is named Place Value because it has a value based on its place. Another interesting fact is that Place Value is the basis of the entire number system.

This activity was very enjoyable because I received plenty of information.

Statistical Investigation

L.I: To read the text, gather, sort, graph and analyse the data.


We learned how to analyse and gather data. We gathered our data by going around the class and asking everyone in LS2 their age. Once we had our data, we made a bar graph on sheets. We then made a DLO about explaining how we found our data. I enjoyed this activity because we had interact socially, and its only been a few weeks in school.

Hello world!

Welcome to your brand new blog – a space to share your learning journey.

To get started, simply visit your blog’s dashboard, edit or delete this post and check out all the other options available to you.

Like more help?

We can walk you through step-by-step in our guide to getting started with your blog.

You can see what other learners are sharing on their blogs here.

Happy blogging!